Learning Systems That Learn — Visualizing Design Intelligence for Every Course
modulr blueprint dashboard
Course
Data Judgment for Consultants: Interpreting, Questioning, and Applying Data Insights
Organization
Insight Strategies Group
Status
Ready
DESIGN RATIONALE — WHAT DID WE PRIORITIZE AND WHY
content priority
instructional priority
design constraint
Data-driven decision judgment — enabling consultants to interpret and apply insights responsibly under pressure to improve deliverable quality and client trust.
Scenario-based decision-making — chosen to simulate real consulting ambiguity and build confidence in framing, interpretation, and persuasion.
Hybrid, asynchronous delivery under 3 hours — requiring microlearning modules, accessible templates, and low cognitive load sequencing.
Operational
Overreliance on intuition vs. data-driven reasoning.
Inconsistent dashboard use across Power BI/Tableau platforms.
Limited time and analyst support during client cycles.
Uncertainty interpreting incomplete or biased data.
Need for credible recommendations without delaying delivery.
who is this for (Audience Snapshot)
Consultants, client service associates, and project coordinators with 2–8 years’ experience.
Operate in hybrid teams (New York, Toronto, Singapore) using Microsoft Teams, Power BI, and Tableau.
Constraints: time pressure, variable data access, and limited formal analytics training.
what it covers (content coverage)
100% of course content mapped from intake and internal guides.
Core themes: framing stakeholder asks, data quality diagnostics, visualization alignment, interpretation with caveats, and scenario-based planning.
SME-pending: thresholds for data anomalies, approved color palettes, and trigger defaults.
how it’s designed
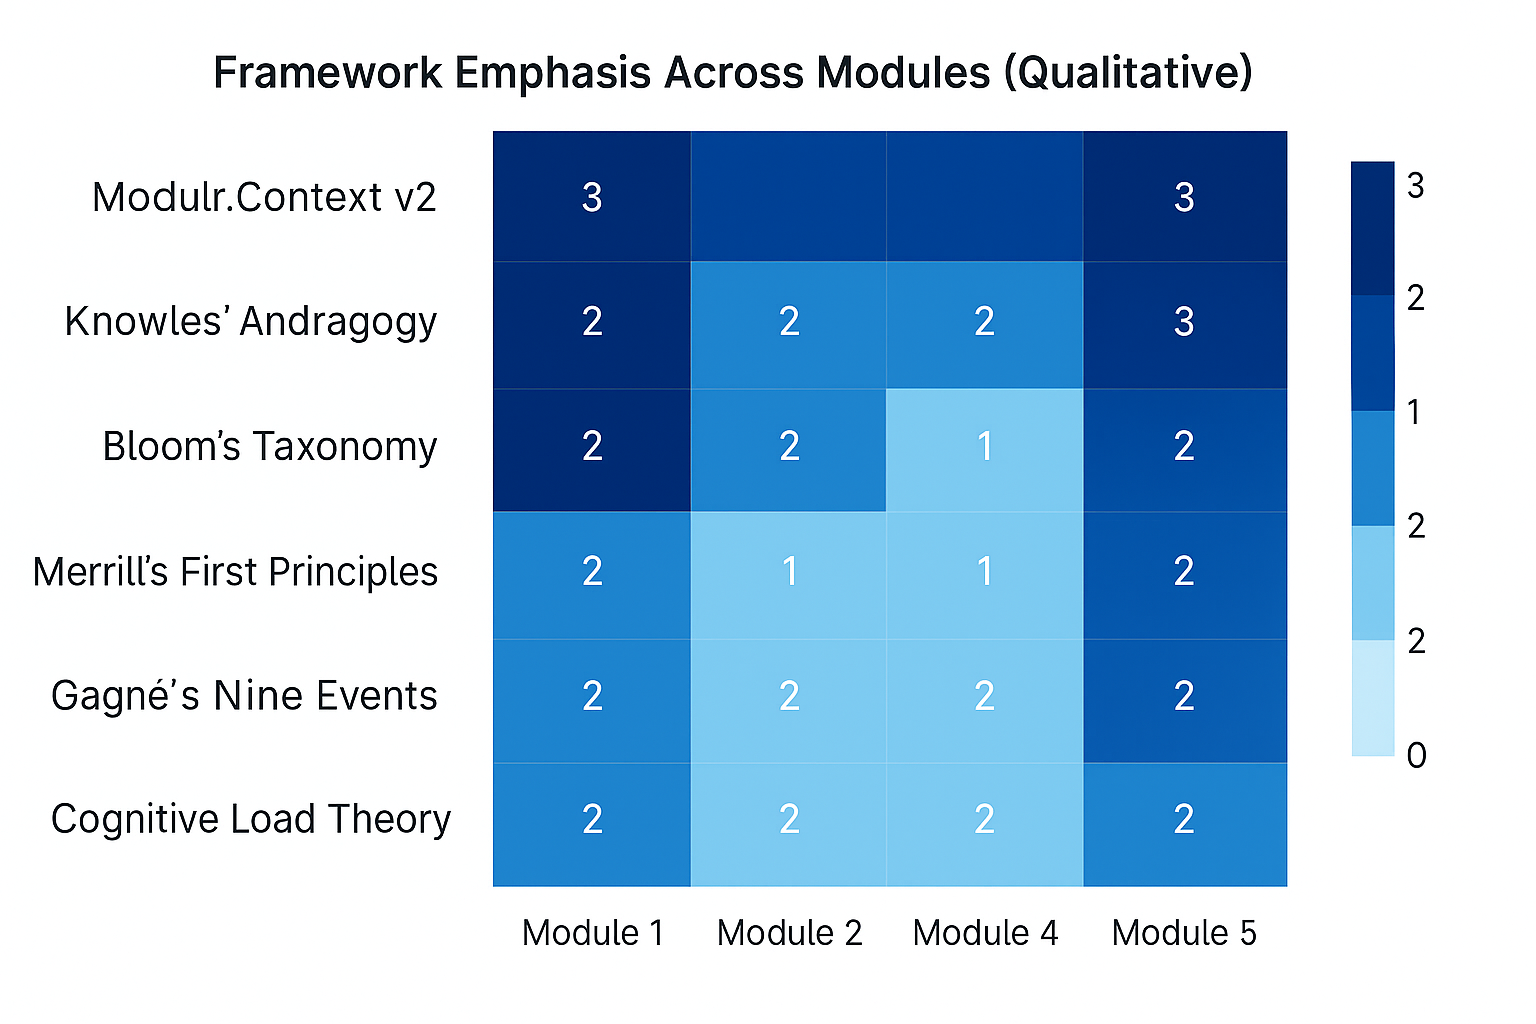
Across all five modules, Knowles and Bloom remain strongest, supporting authentic, high-stakes decision-making. Merrill, Gagné, and CLT appear at moderate intensity to structure practice and feedback. Modulr.Context anchors every judgment prompt in FutureTech’s operational reality, ensuring scenario relevance and policy linkage. Modules 3–5 slightly elevate Bloom-level evaluation and creation tasks through drafting and triage exercises.
Heavier on contextual realism and judgment under ambiguity; lighter on procedural theory or static dashboard tutorials.
DESIGN INSIGHTS — WHAT THIS TELLS US
Strongest design signal: decision-first framing drastically improves data confidence and reduces rework.
Minor growth areas: add learner choice, worked examples, and role-specific job aids.
Facilitators should emphasize diagnostic discipline and trigger-based recommendations.
Next iteration could integrate real client dashboards to extend authenticity.
design drivers
behavioral
operational
technical
Behavioral
what learners will achieve (Objectives
Learners will:
Translate vague stakeholder requests into actionable questions → Module 1
Evaluate data quality and reliability → Module 2
Match visuals to decision purpose → Module 3
Interpret insights with context and caveats → Module 4
Build and compare what-if scenarios → Module 5
Integrate and defend recommendations → Module 6
Objective → Module Map:
Module 1–2 emphasize Merrill (problem framing, demonstration).
Module 3–4 lean Bloom (analyze/evaluate/create) and Gagné (guided practice + feedback).
Module 5–6 heighten Knowles and Context frameworks—autonomy, synthesis, and peer defense. CLT remains moderate throughout via consistent templates.
Design Emphasis: How This Course Differs from Generic Training
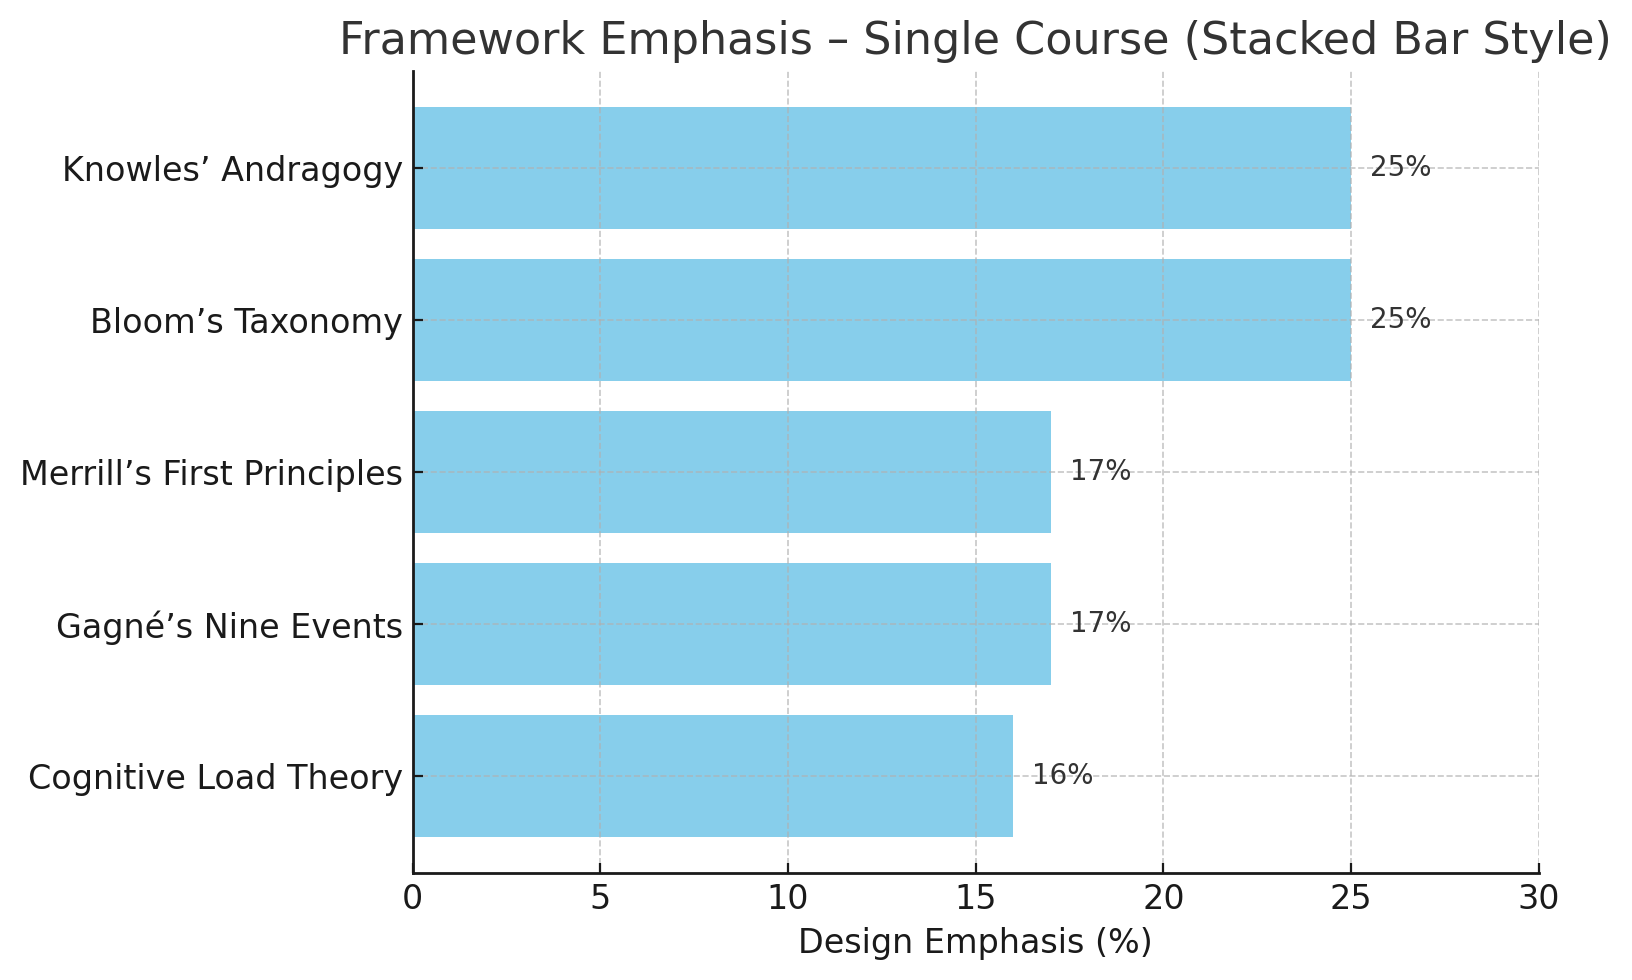
Design emphasis distributes as follows — Knowles’ Andragogy 25%, Bloom’s Taxonomy 25%, Merrill’s First Principles 17%, Gagné’s Nine Events 17%, Cognitive Load Theory 16%. This blend emphasizes real-world autonomy, higher-order judgment, and clear task scaffolding within manageable cognitive load.
MODULE HIGHLIGHTS
M1 – Frame the Question: Translate vague asks into decision-aligned questions; prevents rework.
M2 – Assess Data Quality: Rapid diagnostics for anomalies; credibility over speed.
M3 – Visualization Alignment: Redesign visuals to match decision intent; accessibility built-in.
M4 – Interpret Findings: Write insight + caveat statements; avoid overclaiming.
M5 – Scenario Testing: Build if-then recommendations under uncertainty.
M6 – Integrated Case Lab: Team simulation—apply all skills under time pressure.
DELIVERABLES / DOWNLOADS
NEXT STEPS
Review → Approve → Build → Integrate into LMS.
Option: Request Dashboard Walkthrough for SME artifact alignment.
Team Rating (Pending): ⭐⭐⭐⭐☆
Final feedback summary to be added once implementation is complete.
Metadata and Footer
Generated By: Modulr.Outline v1.4.1
Based On: Modulr.Context v2 and Modulr.AI Behavioral Rules v1.2.5
Compliance Check: ✔ Tier 1 Behavioral Rules
Review Notes: [auto-filled or left blank]
Blueprint Version: 1.0